Interactive case file · Riau Province, Indonesia
Tracking Palm-Oil Development
Move from historical land change to complete plantation fields and palm-count evidence—without exposing the site's geographic coordinates.
01 · Historical evidence
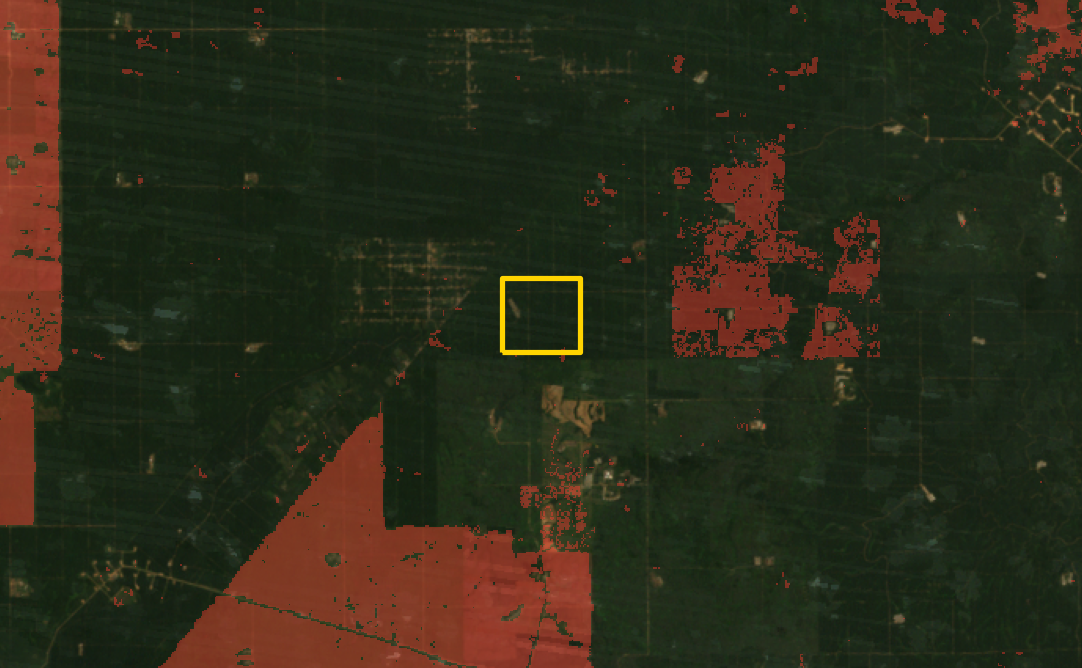
Review the same rectangular landscape through time
Drag the year control or use the arrow keys. Every annual composite keeps obscured pixels below 5% across the displayed crop.
Complete-field boundaryCumulative Hansen lossRed begins in 2001
02 · Field inventory
Inspect fields, attributes and count basis together
The canopy-height background and analytical geometry are translated to a local metre grid. Shape, scale and relative position are retained while geographic coordinates are removed.
18-field result table
Loading field results…
| Count basis |
|---|
Only CF13 and CF17 are direct unique crown-mask counts. Other field counts use the large/small sample method described in the article.
Interpretation boundary
This analysis does not establish the legality of clearing, land ownership, supplier identity, measured crop yield, harvest or shipment history, or regulatory compliance. Field boundaries are analytical rather than cadastral, and palm totals outside CF13 and CF17 are sample-based estimates.
Attribution and Methods
Attribution
- Landsat Collection 2 Level-2 surface reflectance: USGS public-domain data, accessed through Microsoft Planetary Computer.
- Hansen Global Forest Change v1.13: tree-cover-loss year at approximately 30 m, licensed under CC BY 4.0.
- Version 2 High Resolution Canopy Height Maps (CHMv2): Meta and World Resources Institute, 2026, licensed under CC BY 4.0. Source imagery © 2016 Vantor; the canopy-height surface used here is dated 2019.
Methods
- Annual Landsat composites were screened for cloud, cloud shadow, cirrus, snow, saturation and missing data; obscured pixels remain below 5% of each displayed crop.
- Field boundaries follow low-canopy roads and are analytical rather than cadastral.
- The canopy-height background and vectors are translated to a local metre grid; original coordinates and basemaps are not published.
- CF13 and CF17 use direct unique palm-crown-mask counts. Counts for the other 16 fields are sample-based estimates.