Interactive case file · Mato Grosso, Brazil
Connecting Forest Change with Soybean Production Potential
Explore how dated satellite imagery, model-delineated fields, crop prediction and seasonal vegetation activity connect within one reviewable screening record.
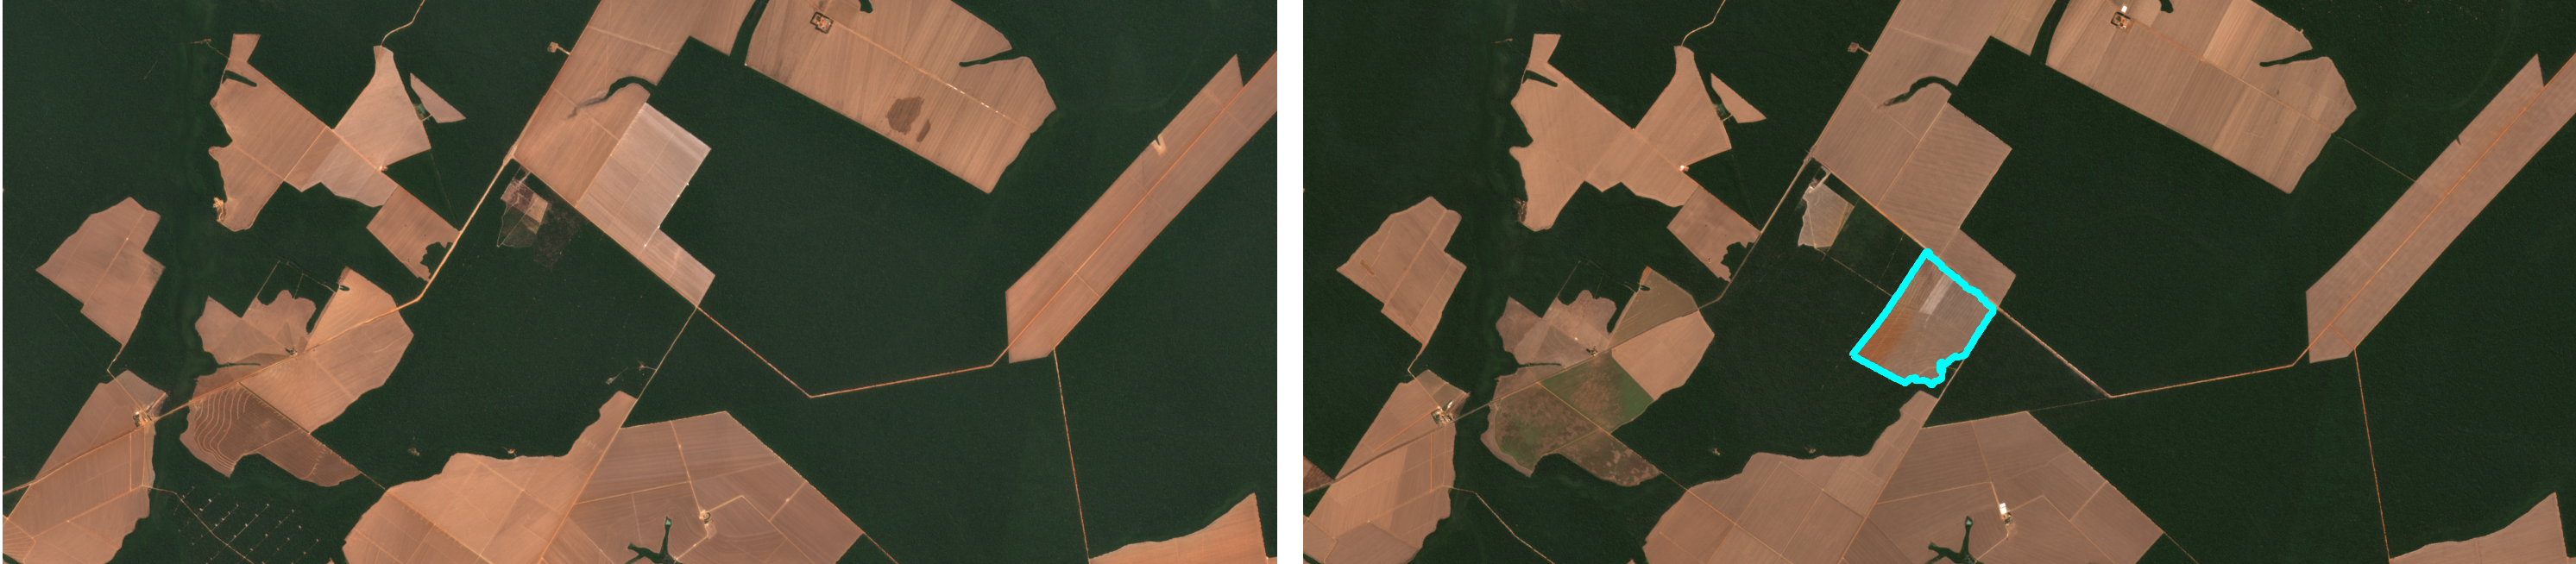
01 · Evidence sequence
From visible change to a field-level signal
Switch between the computed outputs. Each view represents a distinct step in the screening workflow.
02 · Interactive field portfolio
Inspect boundaries and computed results together
Select a boundary on the map or a row in the table. Field 3—the clearing field—remains highlighted in cyan.
77-field screening table
Loading field results…
Some model-delineated field segments overlap. Individual field areas should not be summed as a unique regional land-area estimate.
Interpretation boundary
This is a prioritization screen. It does not establish legal deforestation, ownership, supplier identity, crop yield, harvest volume, shipment history or regulatory compliance. Crop labels are model predictions, and derived boundaries are operational screening units.
Attribution
- Contains modified Copernicus Sentinel data 2022, 2025 and 2026.
- WorldCereal classification module and Van Tricht et al. (2023).
- ESA WorldCover 2021, CC BY 4.0.
- Seasonal vegetation implementation adapted from the Sentinel Hub script, CC BY-SA 4.0.
- Field boundaries generated by running the unmodified Delineate Anything model locally.
- Basemaps © Esri and © OpenStreetMap contributors.